
How's the Market?
First principle: Supply and demand is like a seesaw.
“Sellers Win” Market
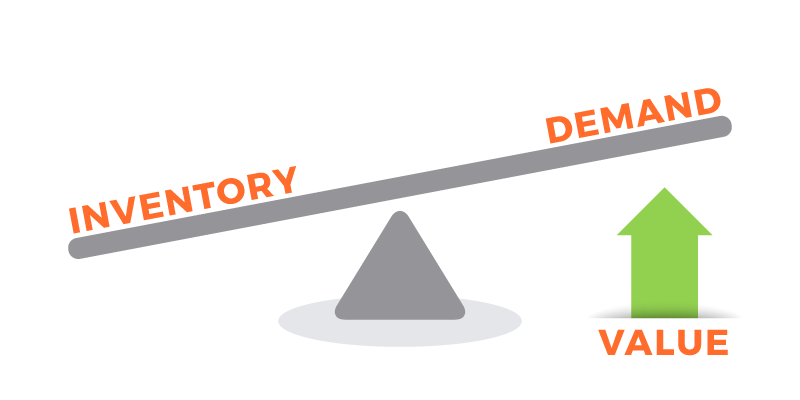
Low inventory creates upward pressure on values. The SELLER has the advantage. Time (meaning one to three years) is on the side of the seller. For starter and move up properties, having one to four months of properties for sale may give the seller an advantage in negotiations. For luxury priced homes, having one to seven months of properties for sale may give the seller an advantage.
“Neutral” or Balanced Market
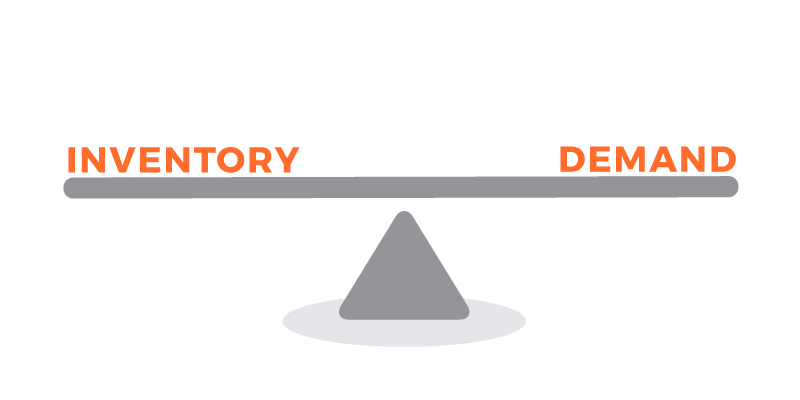
If inventory and demand are balanced, values are normally stable. Neither buyers nor sellers have an advantage. This type of market doesn’t normally last as long. For starter and move up homes, months of supply would be around 6 months. For properties in luxury price ranges, this type of market normally occurs when there are around eight or nine months of inventory.
“Buyers Win” Market
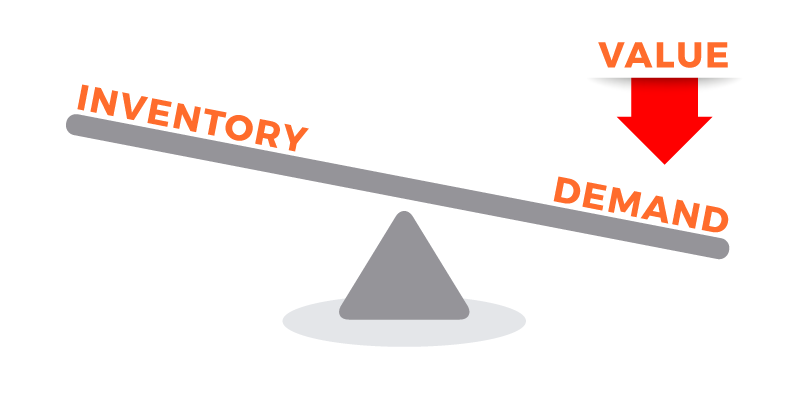
High inventory creates downward pressure on values. The BUYER has the advantage. Time (meaning one to three years) is on the side of the buyer. Unlike the stock market, real estate values tend to come down much more slowly than they go up. After all, sellers are normally selling the home they reside in. The same cannot be said when an owner decides to sell stock on the stock market.
"Sellers Win Market" vs. "Buyers Win Market"
Overall, affordability is suffering in Broward County with high property taxes and expensive insurance costs. That being said, real estate is MORE LOCAL than the weather! For example: it is possible to have a neighborhood of single homes next to a neighborhood of condos. While a good storm would rain on them both, values could be going up in one due to low inventory while values in the other are flat or going down due to assessments or high inventory, etc.
The condo market has more variables to consider than the market for single family houses and townhomes. Oceanfront locations, 55+ complexes, assessments, reserves, minimum down payments, pending lawsuits and other factors can create unique markets for individual condominium complexes.
What is happening in YOUR market? First, find your product (house, townhome, or condo) and then your price range in the charts below to see what the conditions are in your local market.
For more exact guidance, please contact Barry Dunn directly at 954-298-1650.
"Sellers Win Market"
"Buyers Win Market"
Real Estate Market Update for Broward County, Florida
All charts below are updated monthly. Select a link to jump to the corresponding chart.
Last 15 years / Averages
- Single Family Homes – average days on market and average list price to sales price ratio
- Condos – average days on market and average list price to sales price ratio
- Townhomes – average days on market and average list price to sales price ratio
- Last 15 years, all property types, all price ranges
- Average sale price for the last 15 years
- Houses average sales price
- Condo average sales price
- Townhomes average sales price
Single Family Houses
The orange columns indicate the average days on market to sell. The green line shows how much of their asking price sellers got on average, for the properties that sold.
Condos and Co-Ops
The orange columns indicate the average days on market to sell. The green line shows how much of their asking price sellers got on average, for the properties that sold.
Townhomes and Villas
The orange columns indicate the average days on market to sell. The green line shows how much of their asking price sellers got on average, for the properties that sold.
Last 15 years, all property types, all price ranges
Average Sale price (in red) for the last 15 years
Houses Average Sales Price in Red
It should be noted that the large difference between the average asking price and the average sale price is due to the extremely large number of unsold properties in the higher price ranges.
Condos Average Sales Price in Red
It should be noted that the large difference between the average asking price and the average sale price is due to the extremely large number of unsold properties in the higher price ranges.
Townhomes Average Sale Price in Red
It should be noted that the large difference between the average asking price and the average sale price is due to the extremely large number of unsold properties in the higher price ranges.
SINGLE-FAMILY HOUSES
Houses $100,000 to $249,999
Houses $250,000 to $349,999
Houses $300,000 to $499,999
Houses $500,000 to $749,999
Houses $750,000 to $999,999
Houses $1 million to $2 million
CONDOS
Condos $100,000 to $249,999
Condos $250,000 to $349,999
Condos $350,000 to $499,999
Condos $500,000 to $749,999
Condos $750,000 to $999,999
Condos $1 million to $2 million
Townhomes
Townhomes $100,000 to $249,999
Townhomes $250,000 to $349,999
Townhomes $350,000 to $499,999
Townhomes $500,000 to $749,999
Townhomes $750,000 to $999,999
Townhomes $1 million to $2 million
How can we help?
Do you have a question? Need more information? We can help!
Simply fill out the form and we’ll contact you with the answer, with no obligation to you. We guarantee your privacy.